Comparing Java libraries for sunrise/sunset calculation
Author
Klaus Brunner
Published
2025-02-24
How accurate are some of the available Java libraries to calculate sunrise and sunset times? This is not an exhaustive analysis; the idea is to get an estimate of what range of deviations to expect.
All sunrise/sunset calculators are based on more or less detailed models of the solar system. Better models usually result in better accuracy, especially for locations near the poles, where the sun’s light meets Earth’s surface at a shallow angle. However, it’s impossible to predict truly exact times even with the best models: local topography and varying atmospheric refraction have a significant effect on when sunrise or sunset is observed. As Jean Meeus, author of Astronomical Algorithms and frequently cited authority on the topic, puts it: “giving rising or setting times .. more accurately than to the nearest minute makes no sense.”
The contenders in this test are:
Mike Reedell’s sunrisesunsetlib-java (“SRSL”). An old library that hasn’t seen updates in a decade, but seems quite popular judging by its number of GitHub stars. It’s based on a well-documented simple solar system model. It doesn’t support the modern JSR-310 date and time classes, but the API is straightforward to use. For some reason, it uses BigDecimal arithmetic internally, which results in high memory usage and worse performance than plain floating-point (though most users won’t notice unless they run massive bulk calculations).
commons-suncalc. This doesn’t just do sunrise and sunset, but also things like sun position and moon phases. Accordingly, the API is a bit more complex but still easy enough to use. JSR-310 is supported. Documentation is very nice, and the library seems to be actively maintained. The author states explicitly that it’s not focused on maximum accuracy.
My own solarpositioning. As the name suggests, this was originally focused on calculating (topocentric) solar position, with sunrise and sunset added as an afterthought. The sunrise/sunset code strictly follows the algorithm described in the SPA paper, which is among the most complex ones around. JSR-310 is supported. The API is simplistic: just a few static methods with several parameters, no fluent builders.
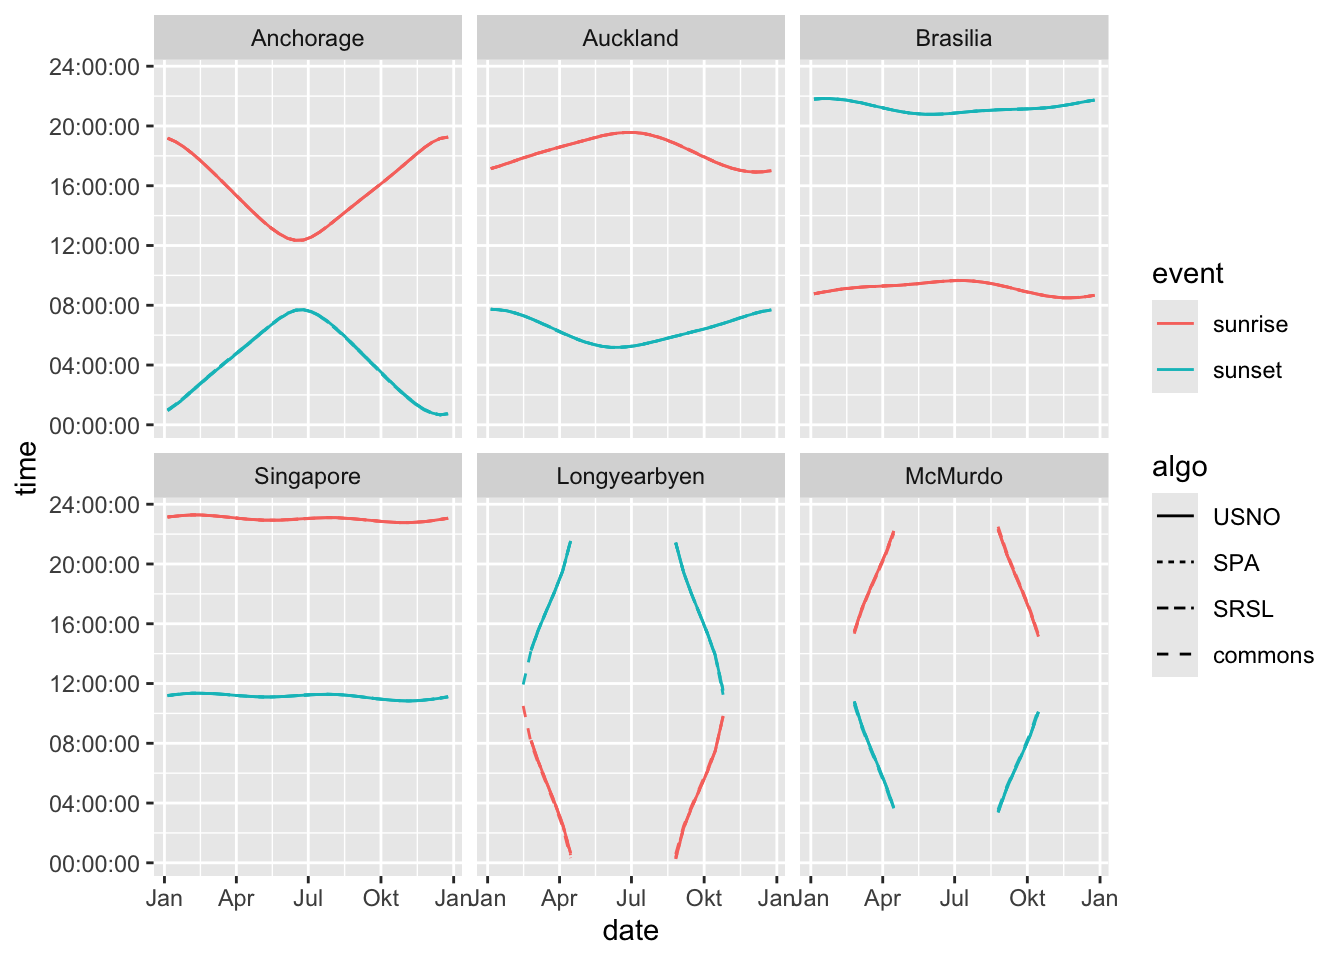
As a reference, the following comparison uses data for the year 2020 in various locations around the world retrieved from the US Naval Office’s website. The data has been reduced to three days in each month (the 5th, 15th, and 25th), resulting in a sample of 36 days for each location. All times are in UTC and rounded to the nearest minute; elevation is not taken into account. The Java code can be found at https://github.com/klausbrunner/sunrise-comparison.
The differences between the libraries and USNO’s data can’t be too dramatic: it’s hard to discern any individual lines except in the most remote locations: Longyearbyen, Norway at about 78° Northern latitude, and McMurdo station in Antarctica (77.85° Southern latitude).
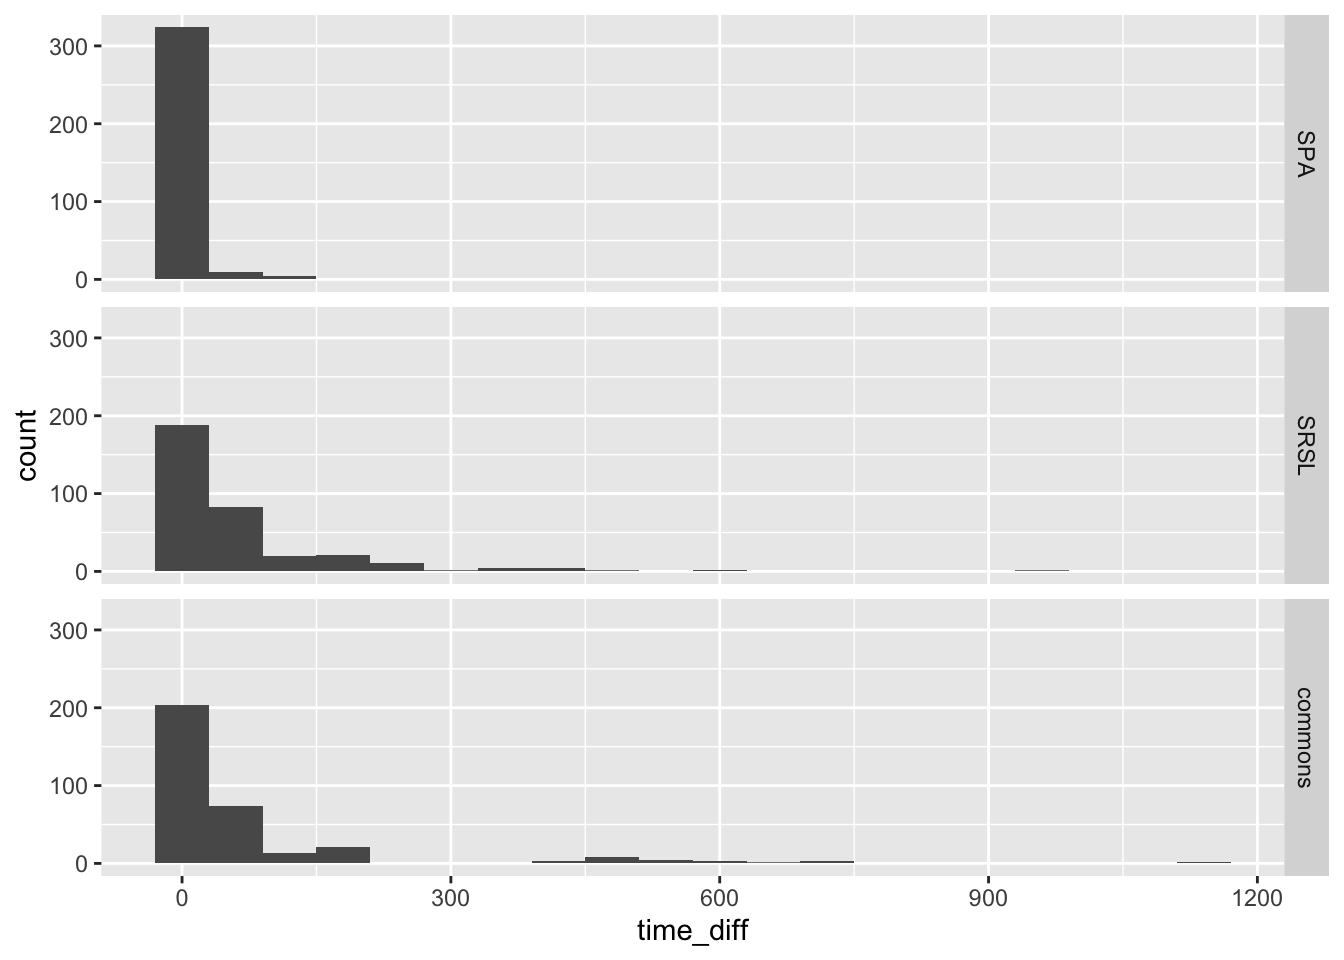
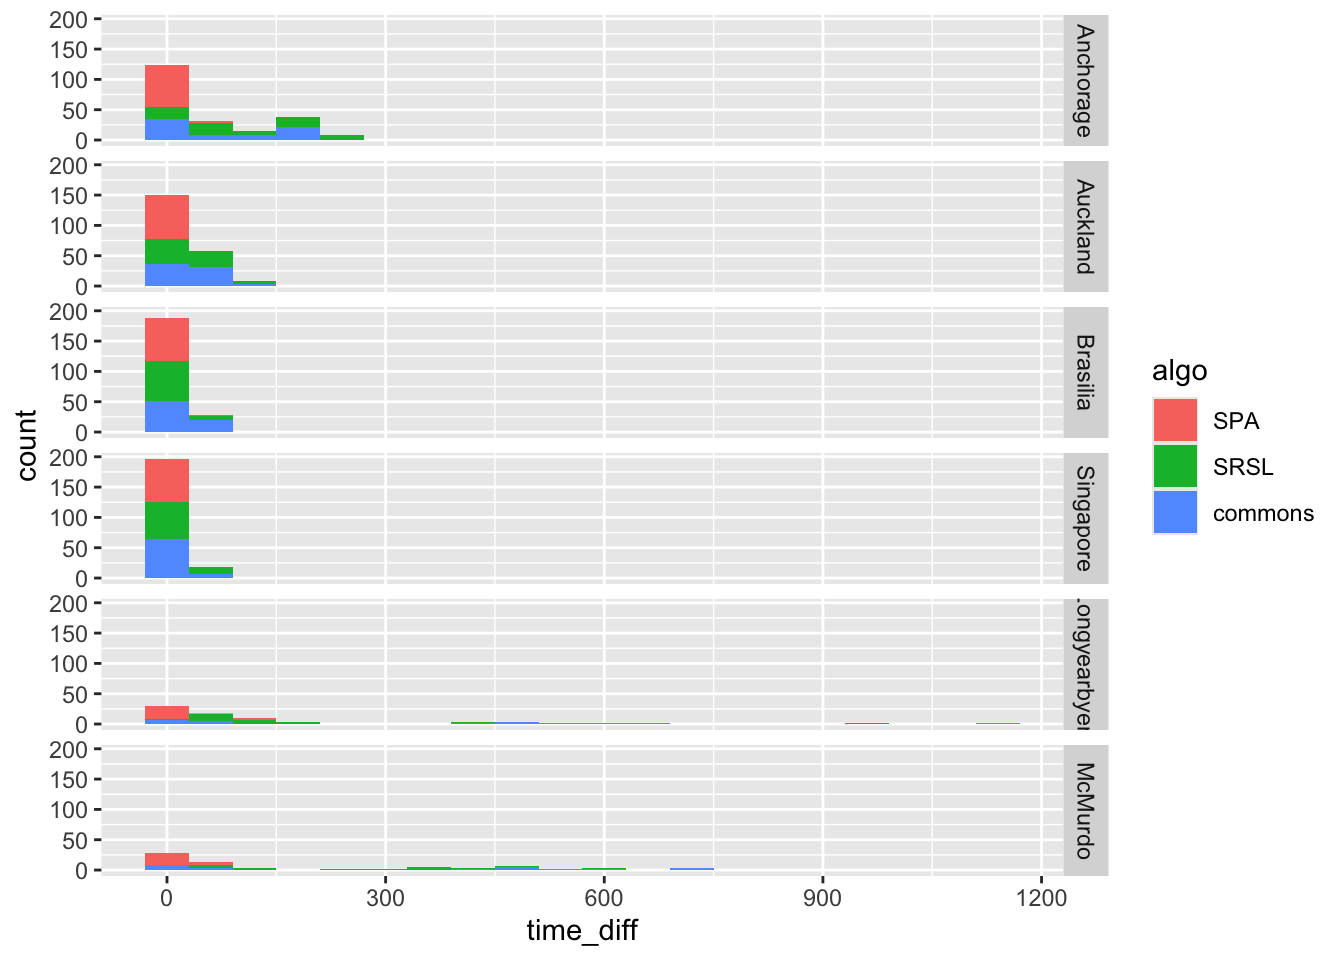
Looking at the differences and their distribution more closely:
As expected, it’s the locations in the far North and South. Somewhat less expected: the dated sunrisesunsetlib performs a bit better than commons-suncalc in this sample. SPA (solarpositioning) never deviates more than 2 minutes from the reference, if at all.
Code
comparison_data |>ggplot(aes(x = time_diff, fill = algo)) +geom_histogram(binwidth =60) +facet_grid(vars(location))
Days of silliness: transitioning in and out of solar days and nights
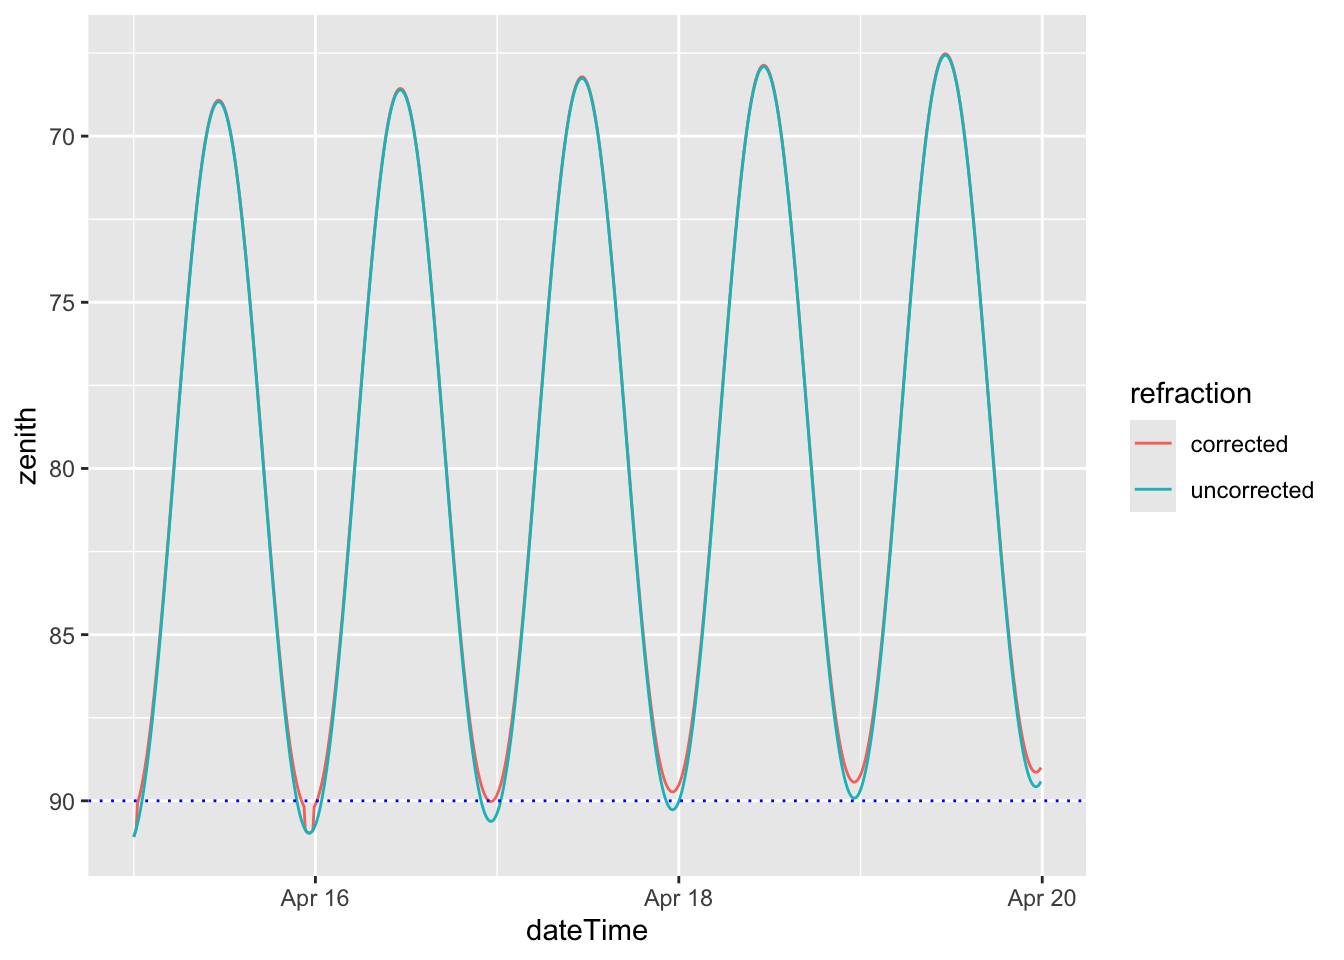
The transition phase in and out of solar days and nights is a challenge for all algorithms. Even respected sources like USNO or NOAA may give widely varying or contradictory results for one or two days when this happens, such as multiple sunsets in a row with no sunrise in between. This isn’t terribly surprising. Let’s look at the situation in Longyearbyen in mid-April 2025 as an example, taking zenith angle data from SPA (getting these as CSV tables is really easy with solarpos). With and without refraction correction, to make things more interesting.
Just how many sunsets are there? How many would a human observer recognise as such?
The “windowed mode” of commons-suncalc is a clever way to deal with this: you can set the search radius for the previous or next event as needed.
Summary
All the libraries perform well enough for many purposes as long as the locations are safely between the polar circles: you can expect deviations of no more than a few minutes. For best accuracy on your next Java-powered polar expedition, I’d suggest to pack solarpositioning (or the SPA algorithm in general).