GraalVM optimization levels matter (and the JVM is amazing)
Author
Klaus Brunner
Published
2025-09-19
Benchmarking some changes to my little solarpos command-line tool, I noticed something odd: the Homebrew-installed version (built with GraalVM native image using “optimise for size”) was dramatically slower than running the same code on the JVM. This sent me down something of a rabbit hole investigating GraalVM’s optimisation levels, with interesting results.
Setup
The solarpos tool calculates solar positions and sunrise/sunset times for given coordinates and dates. In the test configuration running combined coordinate sweeps and time series, it’s essentially a tight loop doing mathematical calculations – date/time arithmetic, trigonometry, polynomial evaluations, and astronomical algorithms. There is some I/O involved (sending CSV records to stdout, which I pipe straight to /dev/null in the test runs), but this doesn’t dominate the workload according to some quick profiling. Perfect for performance testing.
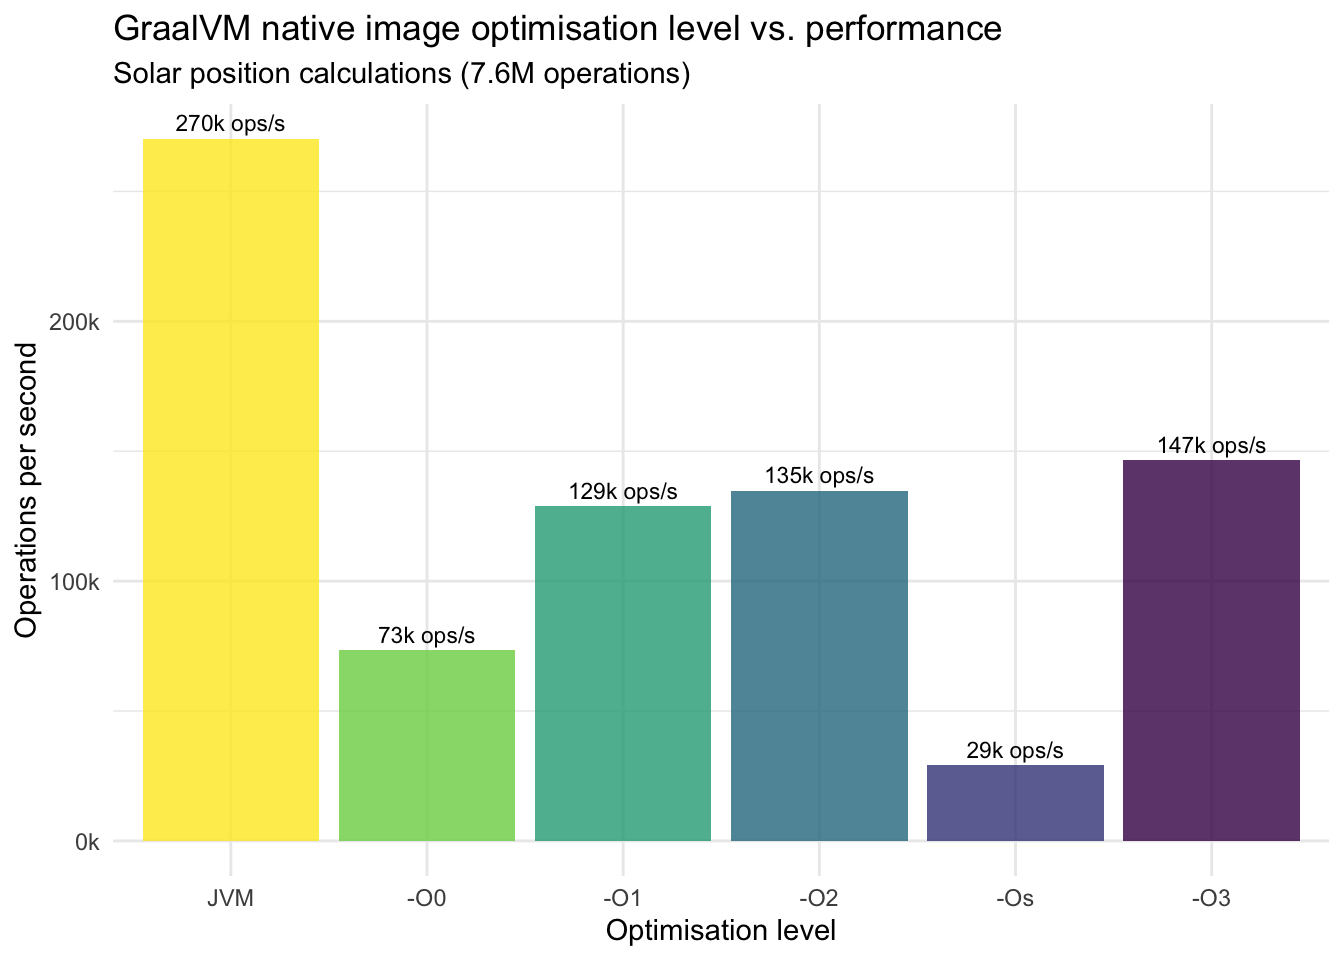
I tested all five GraalVM native-image optimisation levels (-O0, -O1, -O2, -Os, -O3) using GraalVM 25, measuring performance with a workload of 7.6 million solar position calculations. I also included the JVM performance as a baseline comparison.
The most striking finding: -Os is not just slower than -O3, it’s by far the slowest of all optimisation levels. This seems a bit counterintuitive, since -Os is supposed to optimise for size while maintaining reasonable performance. Also noteworthy: the JVM (270k ops/s) significantly outperforms even the best native image option (-O3 at 147k ops/s) by 84%.
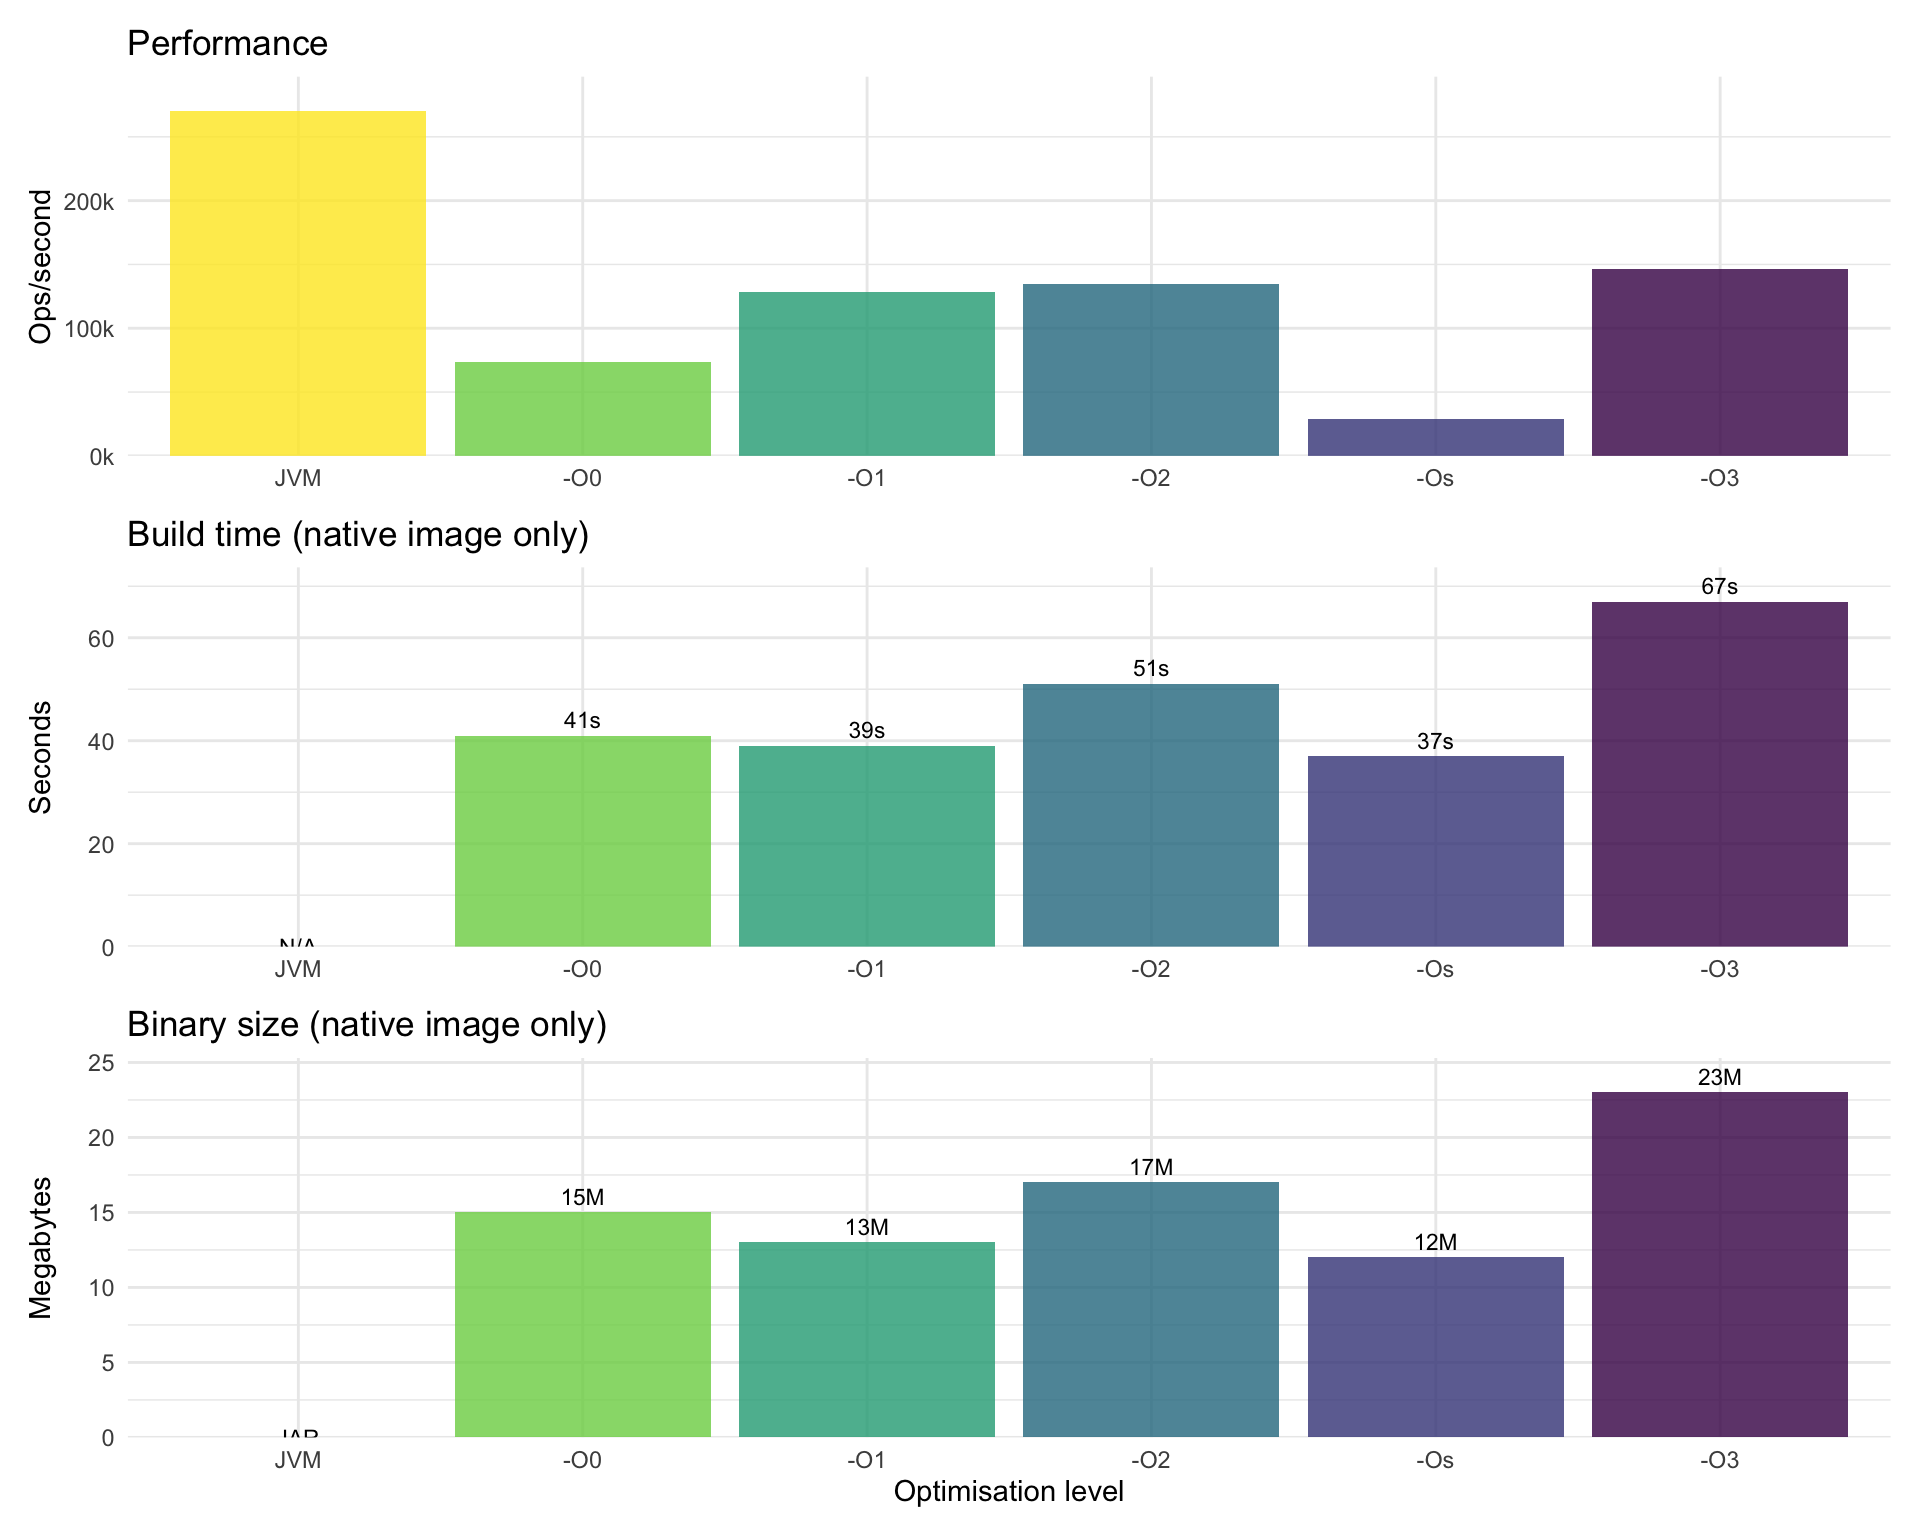
Build time vs performance trade-offs
Code
# Create a combined plot showing the three metricsp1 <- perf_data |>ggplot(aes(x = opt_level, y = performance_ops_s, fill = opt_level)) +geom_col(alpha =0.8) +scale_y_continuous(labels =label_number(scale =1e-3, suffix ="k"),expand =expansion(mult =c(0, 0.1))) +scale_fill_viridis_d(direction =-1) +labs(title ="Performance", y ="Ops/second") +theme_minimal() +theme(legend.position ="none", axis.title.x =element_blank())p2 <- perf_data |>mutate(build_time_plot =ifelse(is.na(build_time_s), 0, build_time_s)) |>ggplot(aes(x = opt_level, y = build_time_plot, fill = opt_level)) +geom_col(alpha =0.8) +geom_text(aes(label =ifelse(is.na(build_time_s), "N/A", paste0(build_time_s, "s"))),vjust =ifelse(is.na(perf_data$build_time_s), 0.5, -0.5), size =3) +scale_y_continuous(expand =expansion(mult =c(0, 0.1))) +scale_fill_viridis_d(direction =-1, drop =FALSE) +labs(title ="Build time (native image only)", y ="Seconds") +theme_minimal() +theme(legend.position ="none", axis.title.x =element_blank())p3 <- perf_data |>mutate(binary_size_plot =ifelse(is.na(binary_size_mb), 0, binary_size_mb)) |>ggplot(aes(x = opt_level, y = binary_size_plot, fill = opt_level)) +geom_col(alpha =0.8) +geom_text(aes(label =ifelse(is.na(size_label), "N/A", size_label)),vjust =ifelse(is.na(perf_data$binary_size_mb), 0.5, -0.5), size =3) +scale_y_continuous(expand =expansion(mult =c(0, 0.1))) +scale_fill_viridis_d(direction =-1, drop =FALSE) +labs(title ="Binary size (native image only)", y ="Megabytes", x ="Optimisation level") +theme_minimal() +theme(legend.position ="none")# Combine plotslibrary(patchwork)p1 / p2 / p3
For mathematical or compute-intensive workloads, at least on Oracle GraalVM 25:
Don’t assume -Os is a reasonable default – it can be dramatically slower than other options.
-O3 provides substantial gains at the cost of longer build times and larger binaries.
-O2 offers a middle ground with good performance and reasonable build times (it’s also the default).
Native Image may not be the best choice for best throughput. For a CLI tool, the main reason to use native-image is fast startup and having a completely self-contained single executable of moderate size on disk and in memory. But when it comes to sheer throughput in long-running calculation tasks, the JVM seems hard to beat.
More things to try
After a very quick test with profile-guided optimisation (PGO) failed to show any improvements, I didn’t investigate this any further. Perhaps it’s worth repeating with a bit more care and better training data.
I also didn’t test any other optimisation flags or tweaks. Java 25 comes with a couple of interesting performance-related options to try out, such as compact object headers or a bunch of GC algorithms to choose from. When using native-image however, the GC selection is very limited and the default (and only reasonable choice that works across all platforms) is the Serial collector.
For this test, I simply used defaults for everything except of course the -O flag of native-image.
Methodology notes
All tests were conducted on an Apple Silicon (M2) Macbook Air using Oracle GraalVM 25+37.1. The benchmark workload consisted of 7,615,728 solar position calculations across coordinate ranges and time series – a realistic computational load for this type of application. Results were verified with multiple runs to ensure stability.
The specific command used for benchmarking was:
solarpos--perf--format=CSV --no-headers 50:55:0.1 10:15:0.1 2024 position --step=3h > /dev/null
This calculates solar positions for a 5°×5° grid (latitude 50-55°N, longitude 10-15°E) with 0.1° resolution across the entire year 2024 with 3-hour time steps.
Build times include both Maven compilation and GraalVM native image generation. Performance measurements used the application’s built-in --perf flag, which tracks operations per second during execution.
The results should be broadly applicable to similar workloads, but as always, benchmark your own code – YMMV.