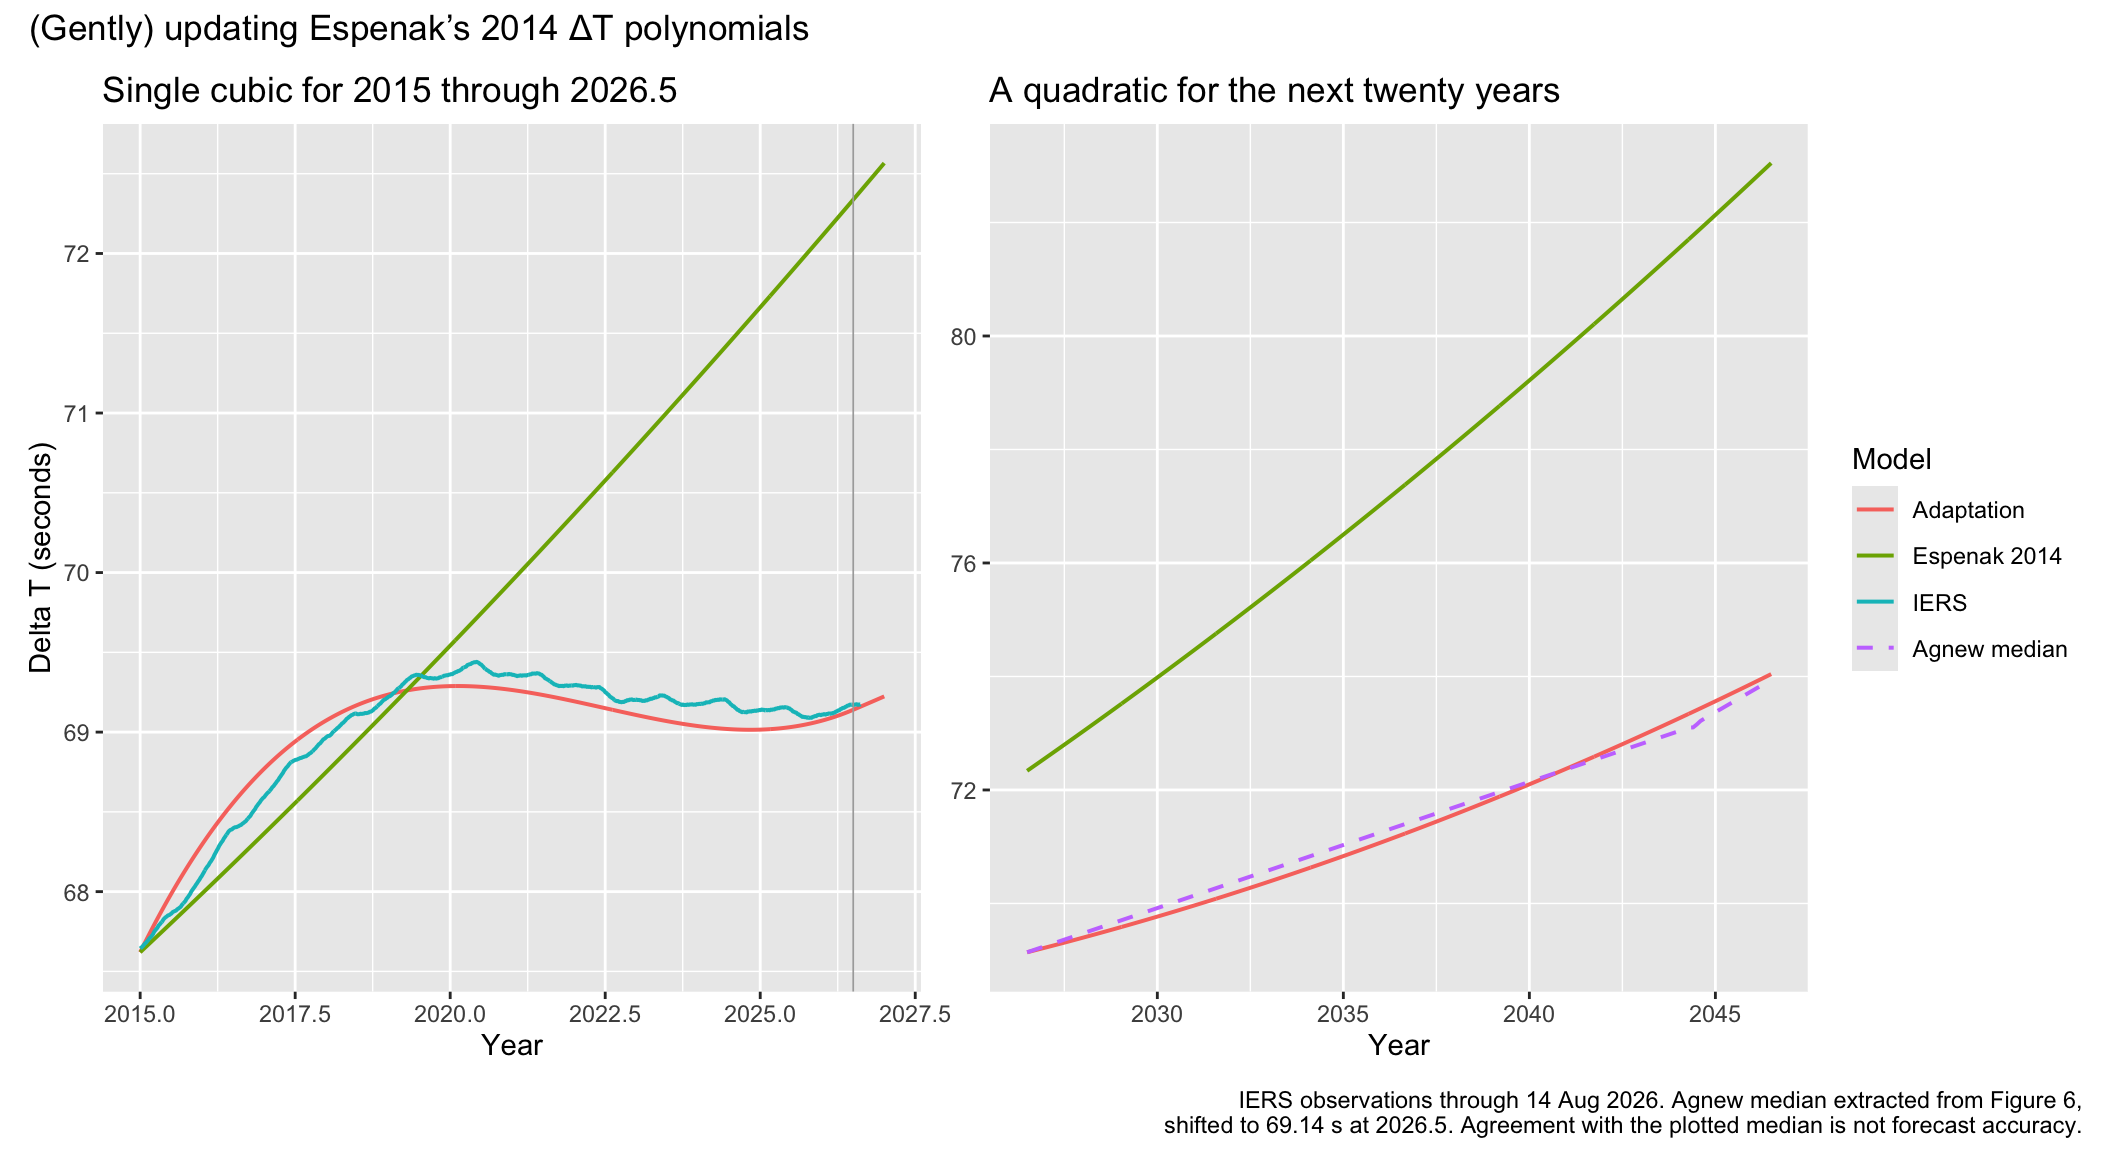
The 2014 ΔT polynomials published by the late Fred Espenak, based on earlier work with Jean Meeus, could use a modest update. For mid-2026, they give about 72.3 seconds, compared with an observed value around 69.2 seconds. I’d like to improve the estimates for recent and future dates while keeping the expressions simple.
The idea is to cover the past decade and use recent research to guide the extrapolation over the next twenty years or so. I’m neither a geophysicist nor an astronomer; this is a practical adjustment for use in software.
Fitting the replacement polynomials
For the observations, I used the IERS C04 daily series, downloaded on 14 September 2026, with data through 14 August. These give UT1−UTC, which can be converted to ΔT using the known TAI−UTC offset and the fixed 32.184-second difference between TT and TAI. (The TAI−UTC offset changes whenever a leap second is added.)
For historical ΔT, Morrison and colleagues’ 2021 update provides an alternative based on cubic splines, with published coefficients extending through 2019.
But what about the future? For short-term prediction, Malkin’s 2024 paper provides a polynomial with periodic terms. Using its published coefficients without refitting, I get a root mean square (RMS) error of about 0.055 seconds over the two years following its fitting interval. That is quite good. By June 2026, its prediction is about 0.1 seconds above the observed ΔT. The paper examines a two-year forecast; extrapolating for another twenty seems risky.
For longer-term extrapolation, Agnew’s 2026 paper, The future(s) of UT1: a geophysical discussion, looks more useful. It combines models of the different contributions to Earth’s rotation and produces 8,000 simulations of its possible future behaviour. Figure 6 in the paper shows the median and the spread of the results through 2100.
Duncan Agnew kindly supplied an updated numerical series (personal communication, 19 September 2026), using IERS data through July.
I used its median as a reference through 2100. Fitting to it gives a systematic way to choose the coefficients, though the result depends on this one model and its assumptions. It would be difficult to claim a scientific consensus for a particular set of polynomial coefficients, especially for an amateur like myself.
I fixed the join between the historical and future expressions at ΔT = 69.14 seconds in mid-2026, close to the observed value. The future expression is nicely unremarkable. For decimal year , let :
I fitted and by least squares to the supplied median at 0.1-year intervals from 2026.6 to 2100. The expression stays within about 0.14 seconds of the supplied median over the first twenty years, and 0.52 seconds through 2100. Close enough for this purpose.
The recent past needs a separate expression. A single quartic covers 2015 to mid-2026 reasonably well. With :
I also fitted the quartic by least squares, using the daily IERS observations with equal weight. Matching the values and slopes of the neighbouring branches at both ends fixes and leaves only to fit; the constraints determine and . Its RMS error is 0.11 seconds, and its largest absolute error is 0.22 seconds. Letting the slope at 2015 vary would give a closer fit overall, but I’m happy to trade a little accuracy for a smooth join.
The branches before 2015 stay as they are in Espenak’s EclipseWise version. The expressions match in both value and slope at 2015 and 2026.5.
The replacement branches, with in seconds and the decimal year, are:
where and . The coefficients are
With years, the length of the quartic’s interval, the remaining coefficients follow from the endpoint values and final slope:
Full-precision coefficients for all intervals are in the appendix. Some example values, in seconds:
| Year | Adaptation | Espenak 2014 |
|---|---|---|
| 2030 | 70.2 | 74.0 |
| 2035 | 72.0 | 76.5 |
| 2040 | 74.1 | 79.2 |
| 2045 | 76.4 | 82.1 |
| 2050 | 79.1 | 85.2 |
| 2100 | 121.3 | 127.3 |
Comparisons and uncertainty
The US Naval Observatory publishes “long-term” ΔT predictions. The table, downloaded on 14 September 2026, ends at 2033.75 and does not state when the forecast was issued. The product page says “from finals.data”, but I was unable to find a description of how the long-term extrapolation is calculated. Comparing the values directly, without any further fitting:
| Year | USNO | Adaptation | Espenak 2014 |
|---|---|---|---|
| 2027.00 | 69.14 | 69.29 | 72.57 |
| 2030.00 | 69.97 | 70.22 | 73.98 |
| 2033.00 | 70.98 | 71.25 | 75.47 |
| 2033.75 | 71.25 | 71.53 | 75.85 |
USNO predicts less growth than the adaptation. Its final entry is about 0.3 seconds below the adaptation. Both are well below Espenak’s original expression.
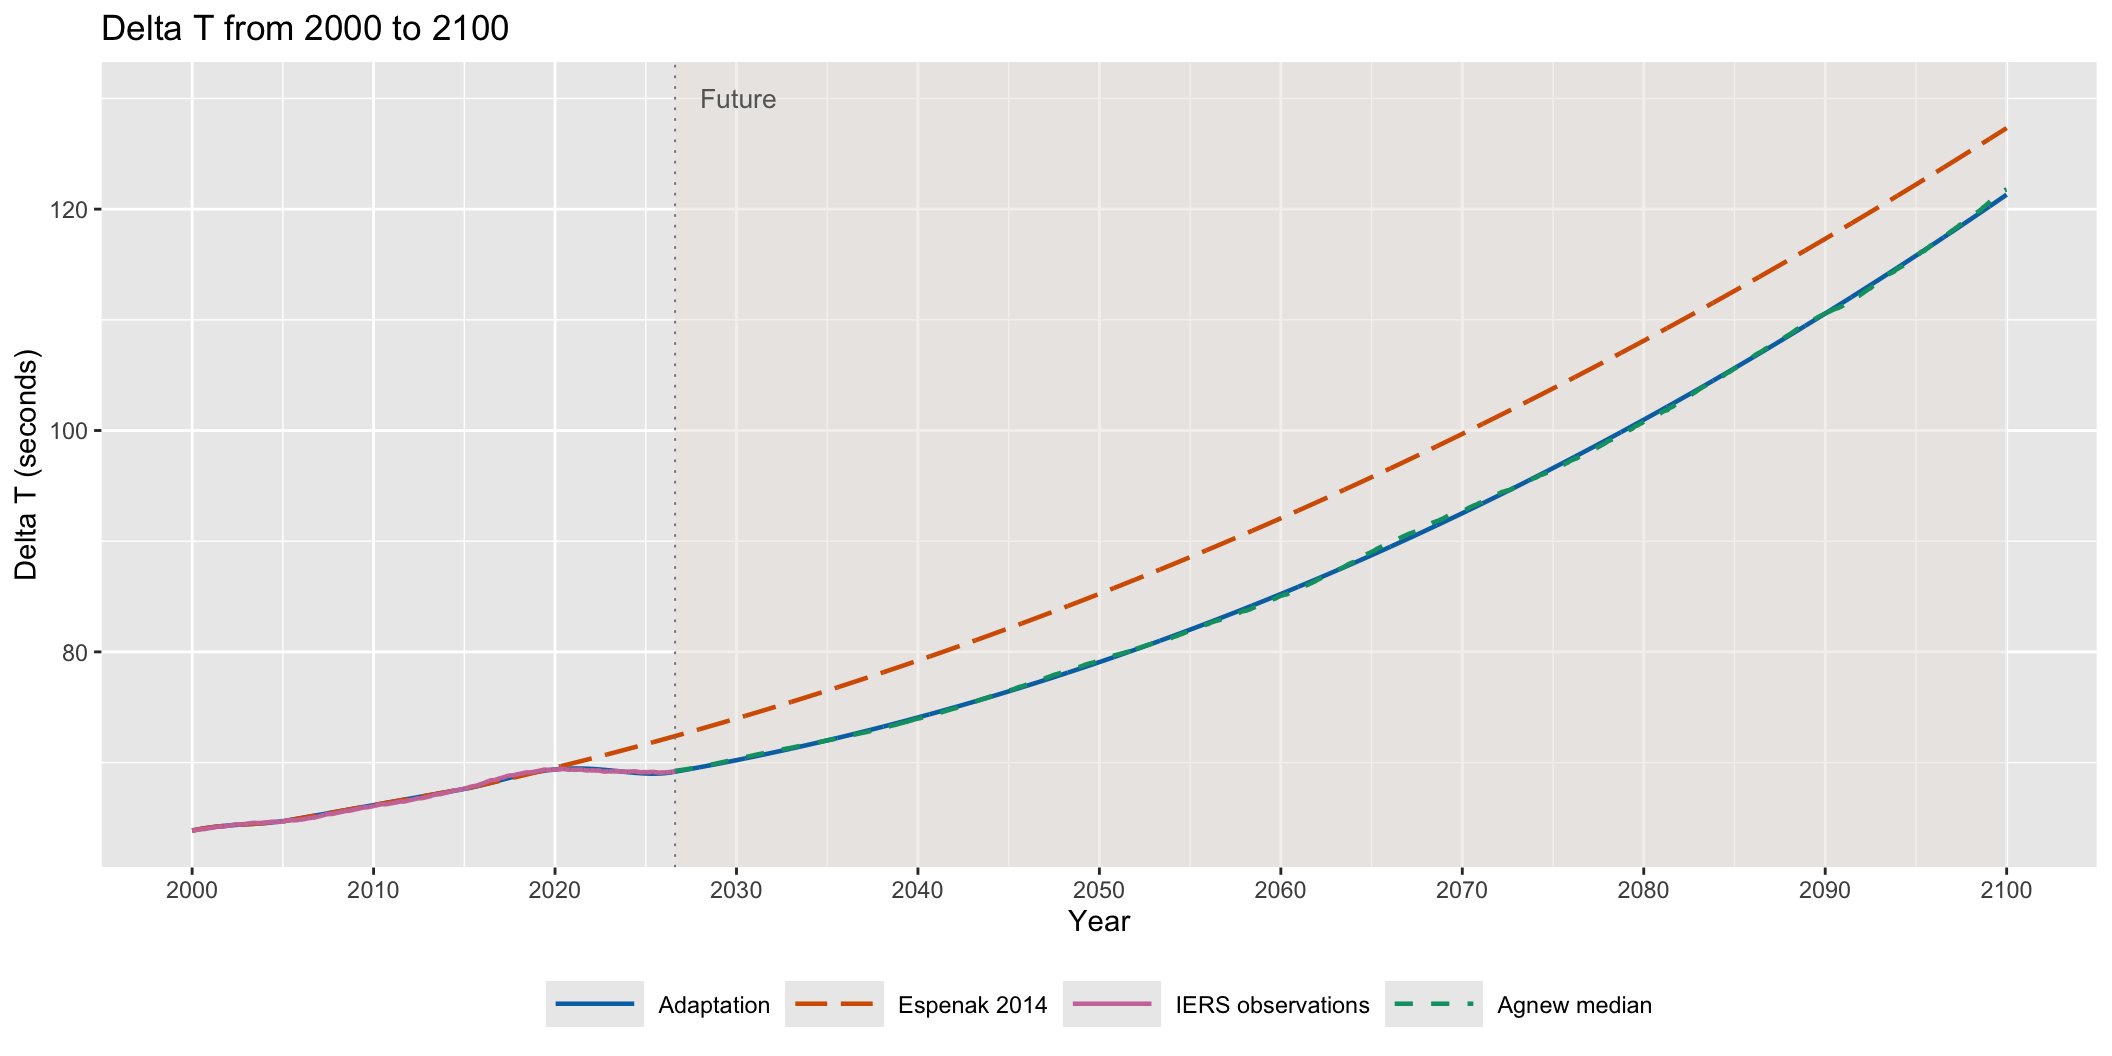
The quartic’s errors are measured against observations; the future expression’s differences are measured against Agnew’s simulated median.
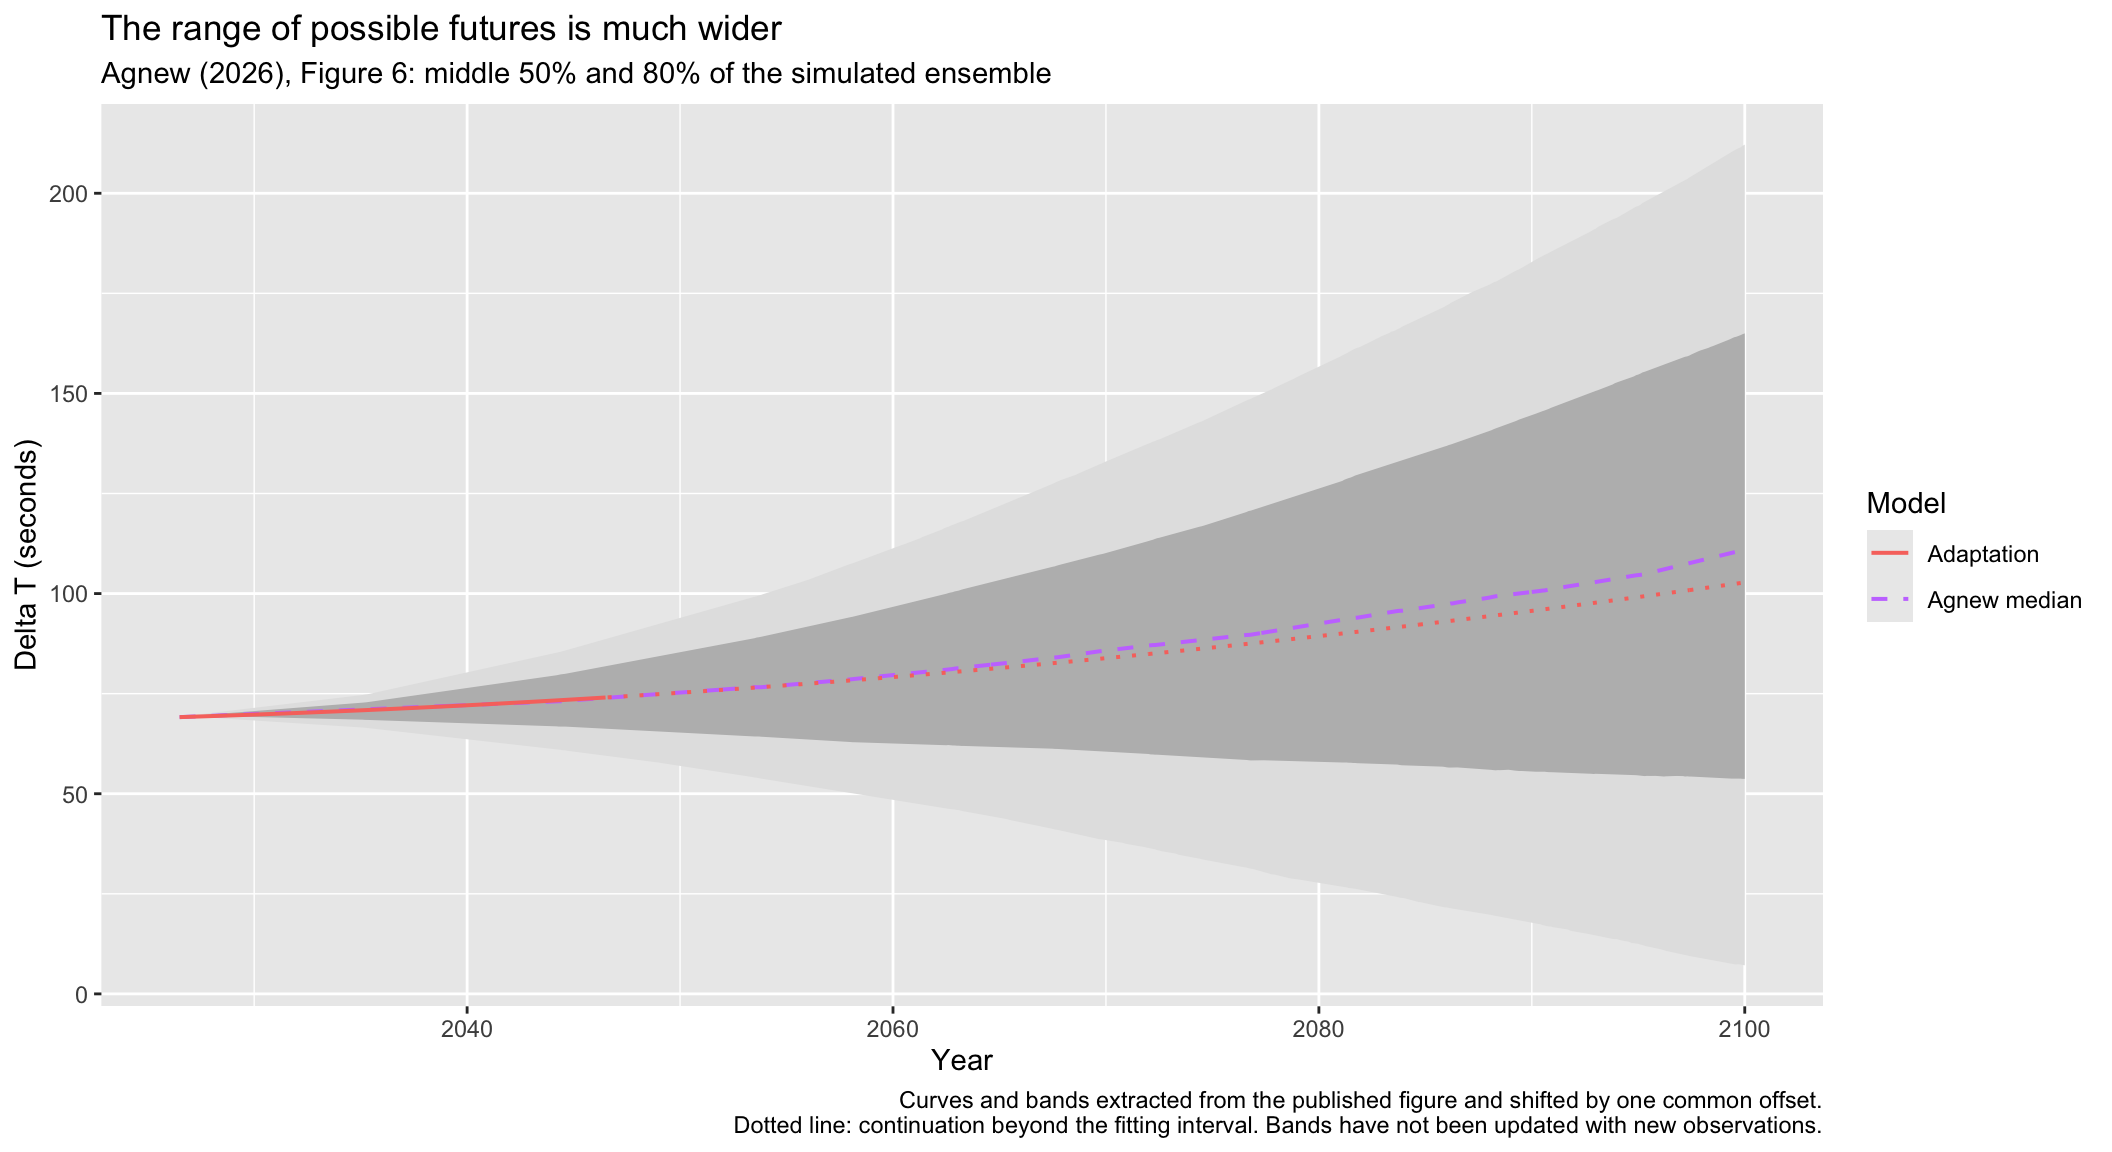
For 2045, the middle 80% of Agnew’s updated simulations lie between roughly 64.5 and 88.7 seconds. That spread is much wider than the fitting error and reflects the assumptions in his model.
As in the original Espenak/Meeus polynomials, the formula will return a value all the way to the year 3000. That is useful for software, but I have no idea if this modification improves on Espenak’s values for the distant future. Fitting a simulated median through 2100 does not make it a reliable prediction for the next thousand years. I would take it as an educated guess, at best.
For recent dates and the next couple of decades though, this adaptation seems a more useful default than continuing to use the old future branch unchanged.
Many thanks to Duncan Agnew for his help and for sharing the updated simulation results!
Appendix: Complete polynomials
The complete coefficient table includes Espenak’s historical branches. For decimal year , use the listed and coefficients in
ΔT is in seconds; coefficients not listed are zero. Year 0 means 1 BCE.
Complete coefficient table
| Interval | Coefficients | |
|---|---|---|
| , | ||
| , , , , , , | ||
| , , , , , , | ||
| , , , | ||
| , , , , | ||
| , , , , , , , | ||
| , , , , , | ||
| , , , , | ||
| , , , | ||
| , , , | ||
| , , , | ||
| , , , , , | ||
| , | ||
| , , , , | ||
| , , |